Updates
Peter's Update Page
The gate drivers are used as a medium between the pulse-width modulated output of the DSP and the input to the switching transistors of the high power circuit. Gate drivers are needed because the DSP’s PWM output does not supply a high enough Voltage to physically switch the transistor. The gate driver has its own power supply and simulates the DSP’s output at a higher power level to effectively control the switching characteristic of the transistor. The IRFP460A high power MOSFET used in this system requires a gate-to-source voltage of approximately 12[V] to completely turn on. Since the DSP provides an output PWM of approximately 3.3[V] at low current, the gate driver would need to provide extra power to the signal to fully turn on the MOSFETs.
For the MOSFETs involved in this system, the IR2110 gate driver was selected. The 2110 is operational for high voltage applications (up to 600[V]). Figure 1 shows a typical configuration for the 2110 connected to a half bridge. This is also the setup used for driving the Buck converter gate and the PFC gate. The two output ports LO and HO on the 2110 are independent of each other and driven by LIN and HIN respectively.
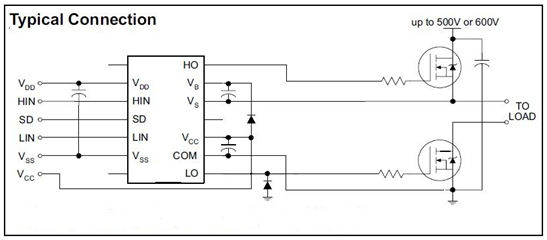
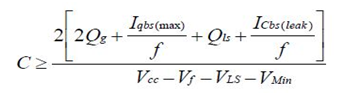
The LO output applies the voltage value of Vcc to the LO side MOSFET gate. The HO output provides enough voltage to the High side MOSFET gate such that the gate-to-source voltage maintains a drop of at least 12[V]. This is accomplished via the bootstrap capacitor that is shown in figure 1 between Vb and Vs. The calculation for the bootstrap capacitor is shown below where the definitions of each of the variables are explained in application notes for the IR2110. Once the correct value of the capacitor is calculated, it is recommended in practice to multiply that value by an order of magnitude in order to maintain a safety cushion.
This Bootstrap capacitor is necessary for the Buck converter because the source of the MOSFET in the Buck converter is not tied to a high power ground. This causes the source voltage to be non-zero and requires a higher voltage than the value of Vcc alone. Note that the frequency of operation plays a large role in what size this capacitor may be. As the high side FET turns off, current flows from Vcc through a diode into Vb and thereby charging the bootstrap capacitor. Once the High side FET needs to turn on, charge is pulled from the capacitor and Vcc in order to produce the necessary increase in voltage for properly switching the FET.
One of the primary goals of this project is to optimally charge a high power battery. The battery selected for charging is a 14 Cell (58.8[V]) Lithium-Ion Polymer Battery with a total rated capacity of 10[Ah] and can be seen in figure 2
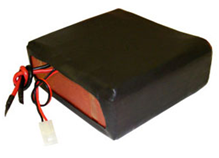
Figure 2 – 58.8[V] Lithium Ion battery pack
In order to optimally charge a Li-Ion battery, an understanding of various charging methods and charging stages of Li-Ion cells is necessary. A break-down of the charging stages can be seen in figure 3. Note that the plot applies to a single Lithium cell.
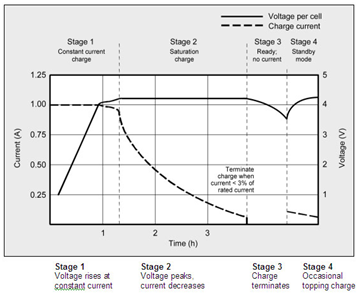
Figure 3 – Charging Stages of a Lithium Polymer Battery
Lithium-Ion cells have a potential of 4.2[V] at maximum capacity. As the battery discharges, the operating voltage drops in kind. However, there is a state of charge where the battery is at maximum voltage, but is not fully charged. As seen in figure 3, the first stage of charging is constant current charging. This is where a variable voltage is applied the battery to maintain a constant current flow until the battery reaches its maximum rated voltage (in our case, 58.8[V]. At that point, the voltage is kept constant, and the current applied is gradually reduced over time until the battery is on being charged at 3% of its rated current value (in our case, 300m[A]). This second stage of charge is known as the saturation stage where the charge on the surfaces of the anodes and cathodes are dispersed throughout the bodies of the cells. Stage 3 simply represents the point when the battery is ready to operate as expected. Stage 4 briefly describes the situation of what the battery does when it is idle for quite some time.
During standby mode in stage 4, the battery gradually and slowly leaks charge. The self discharge associated with some batteries is often countered with a process known as trickle charging. Trickle charging is the process of applying small pulses of charge to the battery at a rate equal to the self discharge of the battery. While this sounds good on paper, this is a poor plan for Li-Ion batteries. Maintaining maximum state of charge on a Li-Ion battery puts a large amount of stress on the cells, and shortens the overall lifespan of the battery. Maintaining maximum charge or even potential over-charge causes metallic lithium plating on the cell nodes. The plating causes poor power transfer during charging and discharging and ends up dissipating large amounts of energy into heat.
Internal Resistance
In order to maintain a constant current being applied to the battery, we need to know the internal resistance of the battery. To assist with this, a battery model can be developed for the Li-Ion battery. A generic model can be seen below in figure 4.
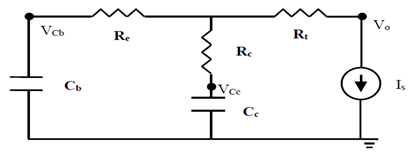
Figure 4 – Generic Lithium-Ion Battery Model
The problem encountered with the model above is that finding the individual components for the battery model proved impossible without some form of software taking multiple data points as the battery runs through several discharge cycles. The reason such a detailed process is required is that the internal resistance values vary slightly with State of Charge, temperature of the battery, and rate of charge/discharge. To demonstrate the concept on how we would take measurements of the battery’s internal resistance as a whole, a single pulse discharge was applied over period. Of approximately 30 seconds in figure 5.
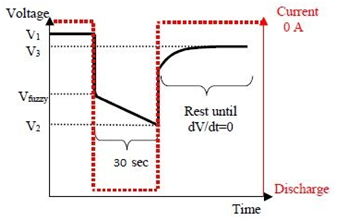
Figure 5 – Singular Pulse discharge of a Battery with relevant measurements
From this process, we were able to derive a single value for the overall internal resistance of our battery at approximately 90% SOC. The data taken is in table 1. We were able to find out that the internal resistance of our battery when at high capacity is 108m[Ω]. This tells us only what the overall resistance is at that state of charge. A more complete table would need to be formed in order to have an accurate model for the battery. With an accurate model, we would be able to control the voltage applied to the battery via controller much great precision.
Vr |
56.530 |
R |
10.910 |
V1 |
57.850 |
V2 |
57.160 |
V3 |
57.720 |
I |
5.181 |
Rint |
0.108 |
Table 1 – Voltage measurements
for Li-Ion battery after 30 second
pulse discharge