The Project
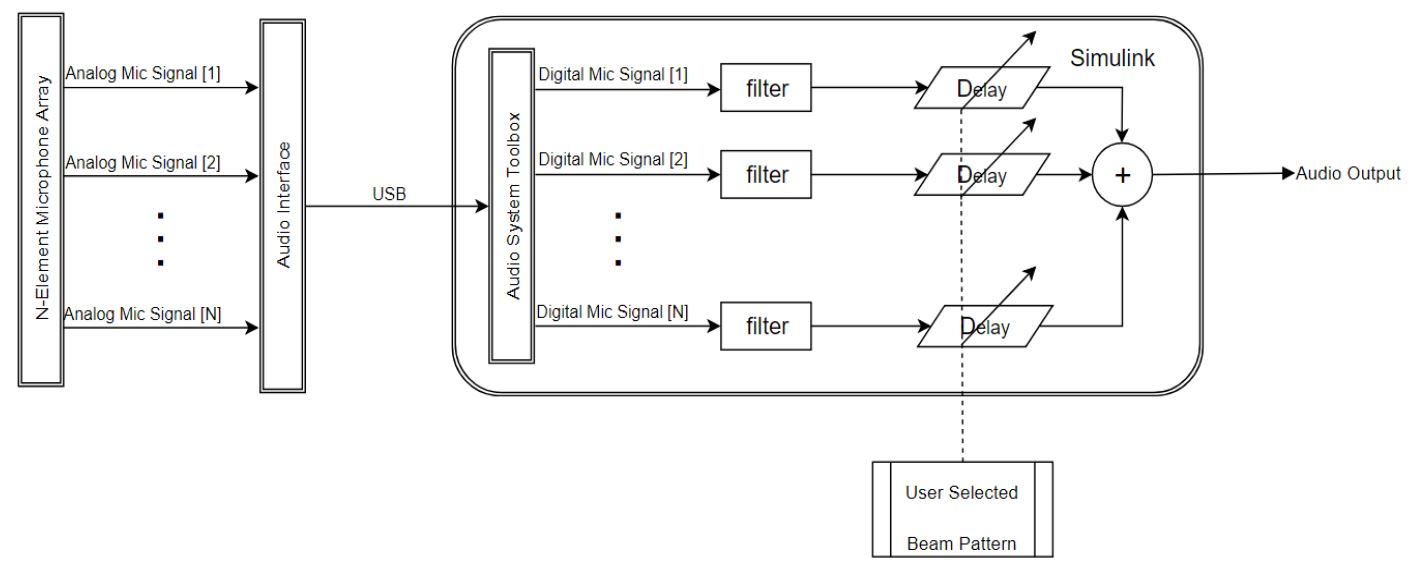
System Level Diagram
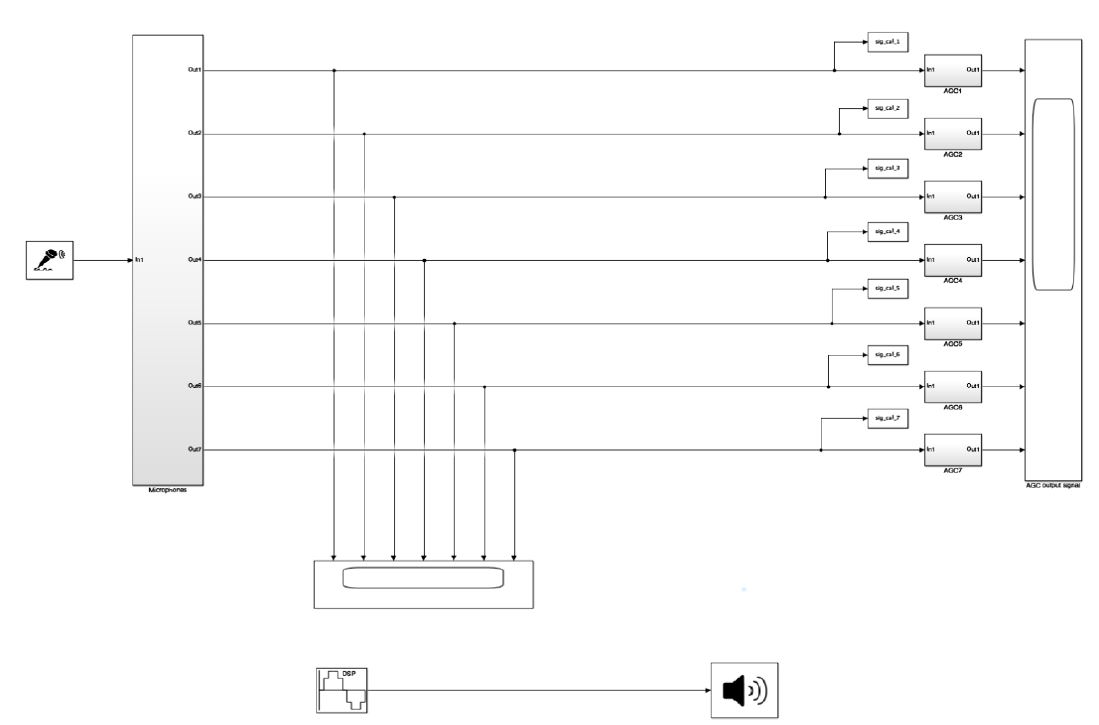
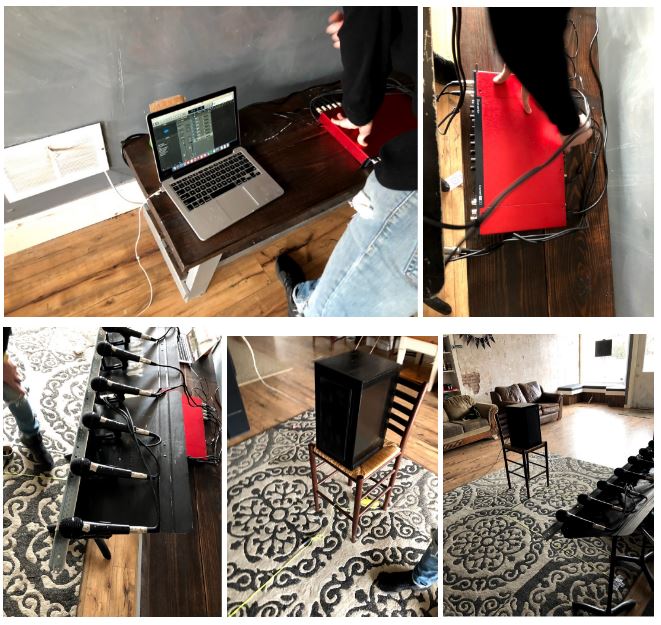
The system is comprised of an N-element microphone array connected to an audio interface. This project uses
7 microphones connected via XLR to the Scarlett 18i20 digital interface. The interface connects to a laptop
over USB. Simluink connects to the audio interface and captures the audio data coming to the microphones.
The audio data is obtained using the Audio Systems Toolbox obtained through Mathworks. The digital audio
data goes through A-Weighting filters. The delays are then applied to the audio and their frames are summed.
The audio is then outputs through a speaker or audio recording device. Note that the user can change the
beam pattern. The only part of the system changed when the user changes the beam pattern is the amount of
delay applied to each microphone.
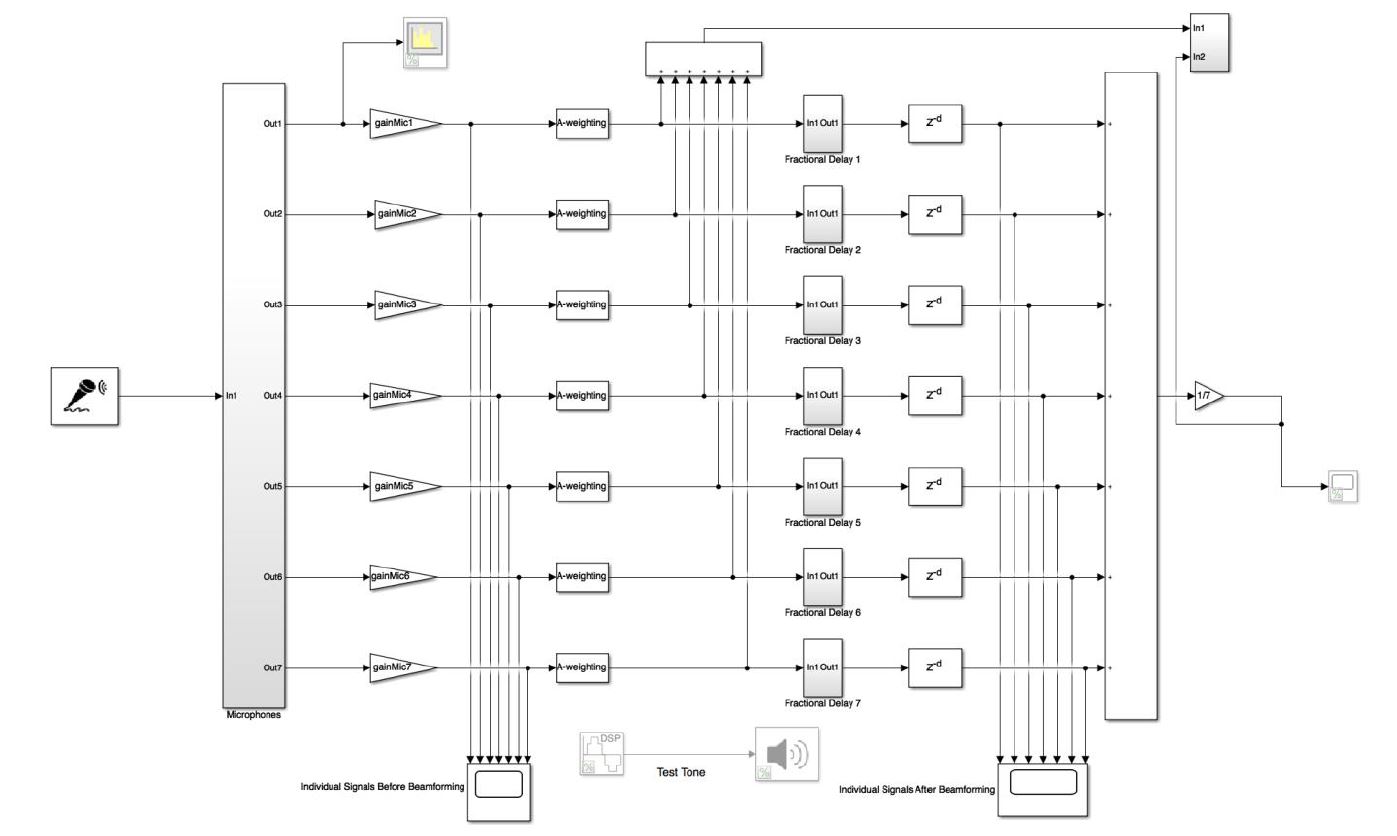
Simulink Models
These models represent our functional system. The real-time Simulink model provides the model that performs
delay-and-sum beamforming. To test our real-time model, we first use a simulation input block. To calibrate
the system there is a calibration model and an automatic gain controller model. The calibration model calculates
the delay for the system. The automatic gain controller (AGC) model calculates the amount of gain to add to each
microphone signal, so they become more closely matched. Both of these calibration steps are ran in the same
Simulink model. First a tone of 300 Hz sine wave is played to calculate the delays. Then a 1kHz sine wave is
played to calibrate the AGC. Overall, the calibration process takes under 45 seconds to complete.
Real Time Simulink Model
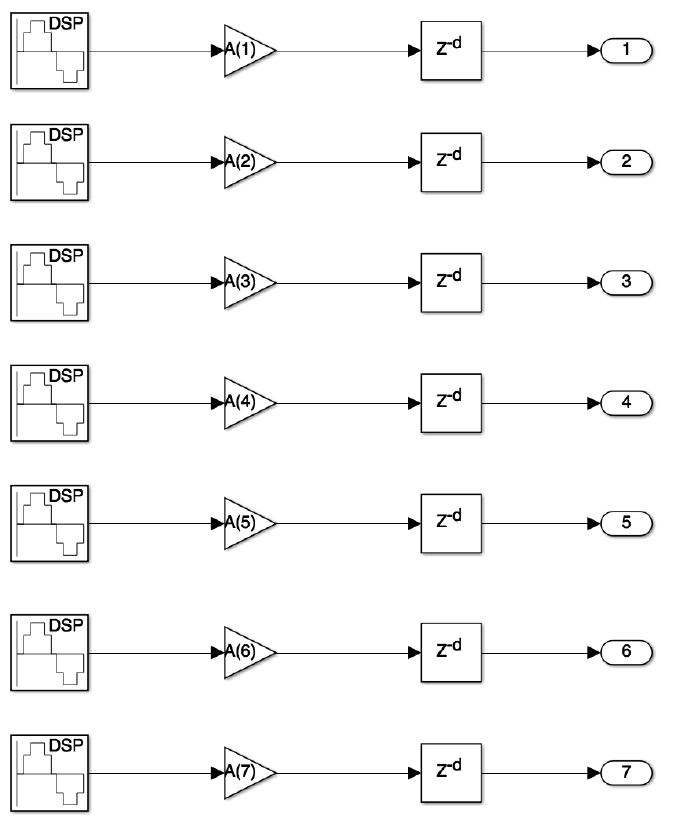
Simulink Simulation Input Block
Simulation Calibration Model

Automatic Gain Controller Block
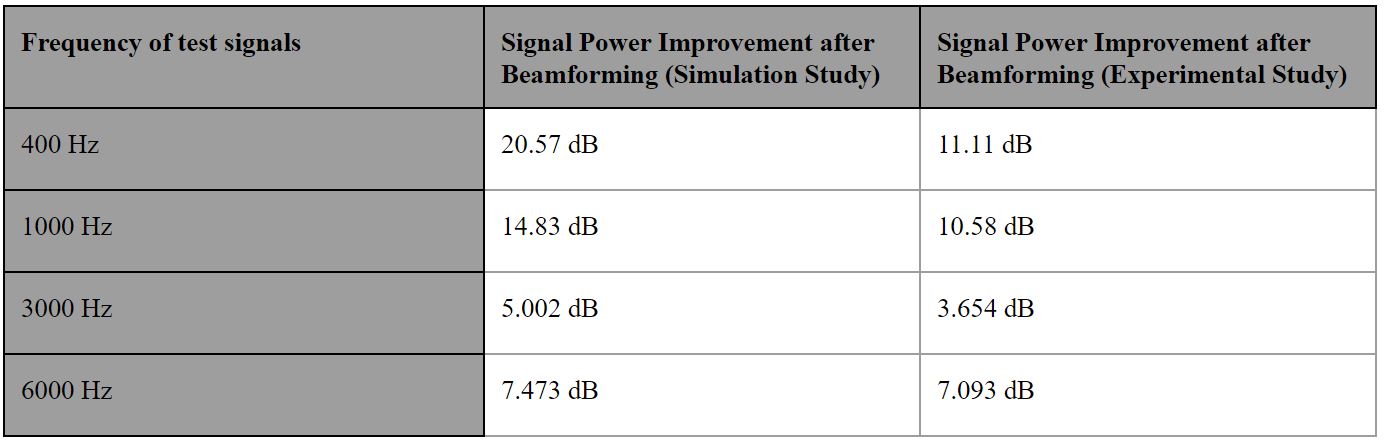
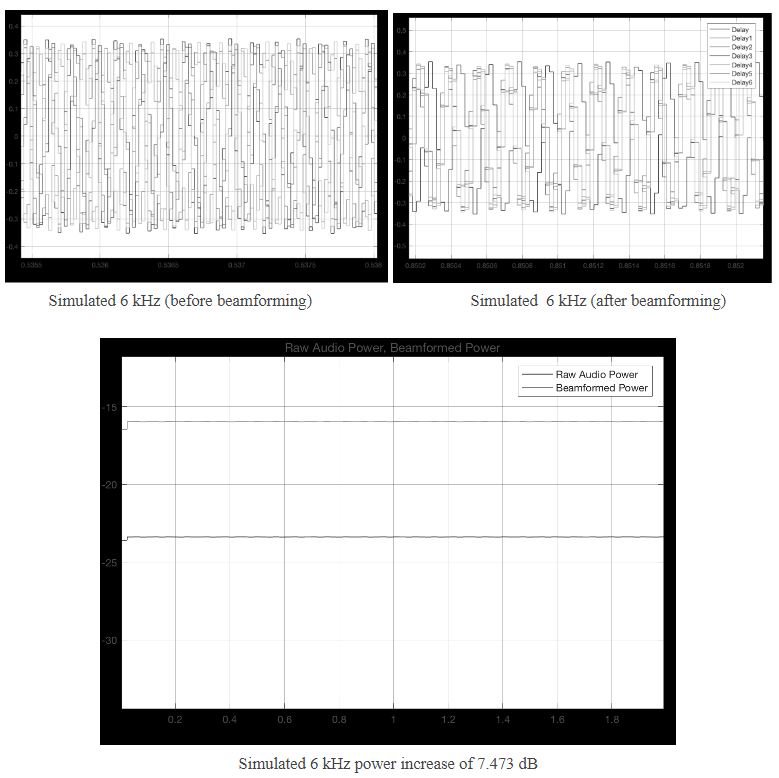
Simulated Results
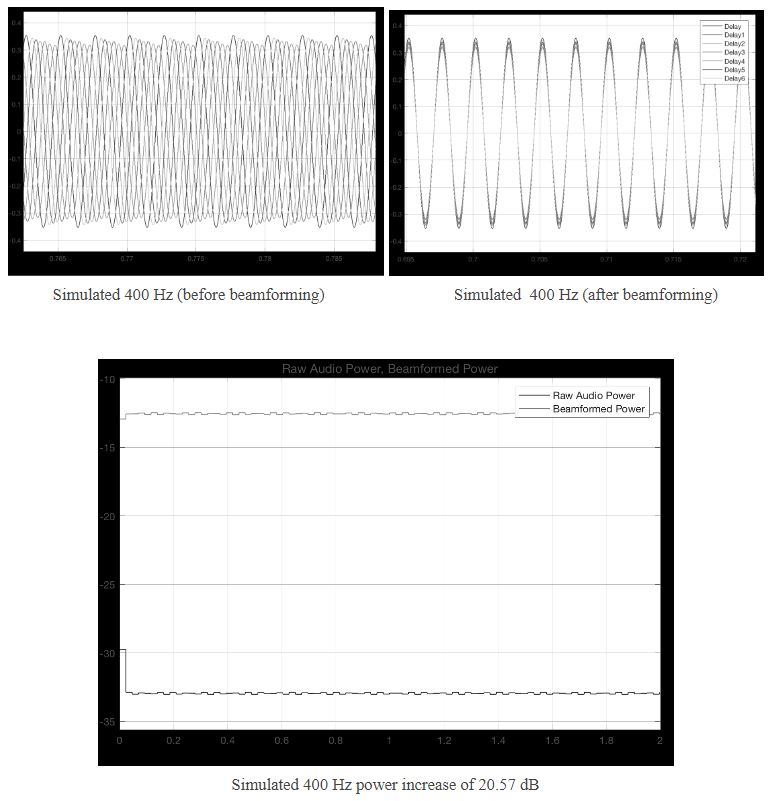
First, the simulated results are shown. The goal of the simulated results is to show the maximum amount of
signal improvement that can be obtained at target frequencies. Signal improvement is defined as a higher
average power over a frame. The target frequencies are 400 Hz, 1kHz, 3kHz, and 6kHz. For simulation, DSP
blocks simulate the sine wave with different phases to simulated hitting the microphones at different times.
Simulated 400 Hz Signal
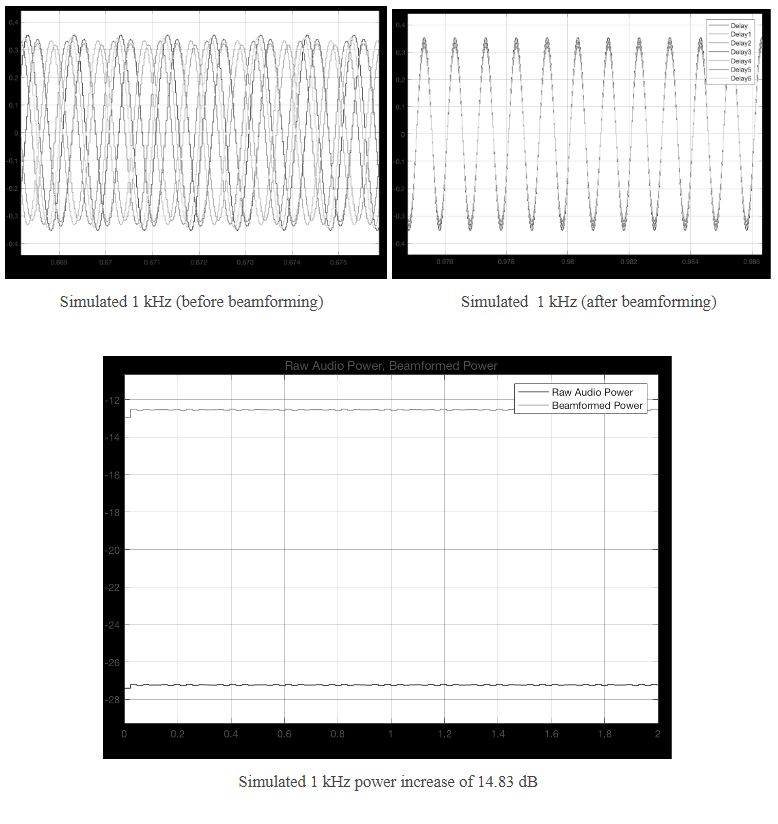
Simulated 1 kHz Signal
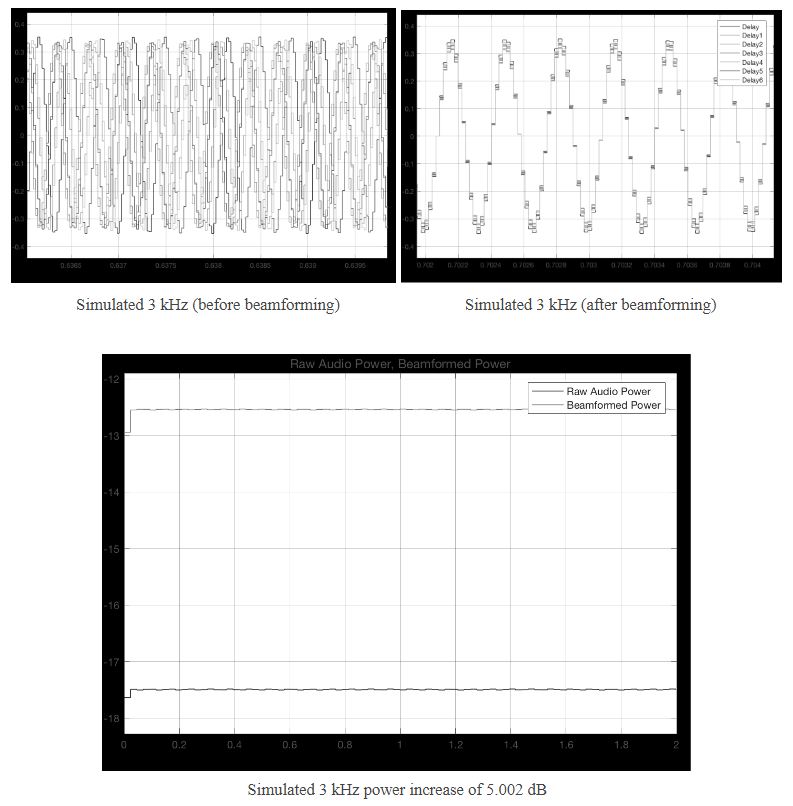
Simulated 3 kHz Signal
Simulated 6 kHz Signal
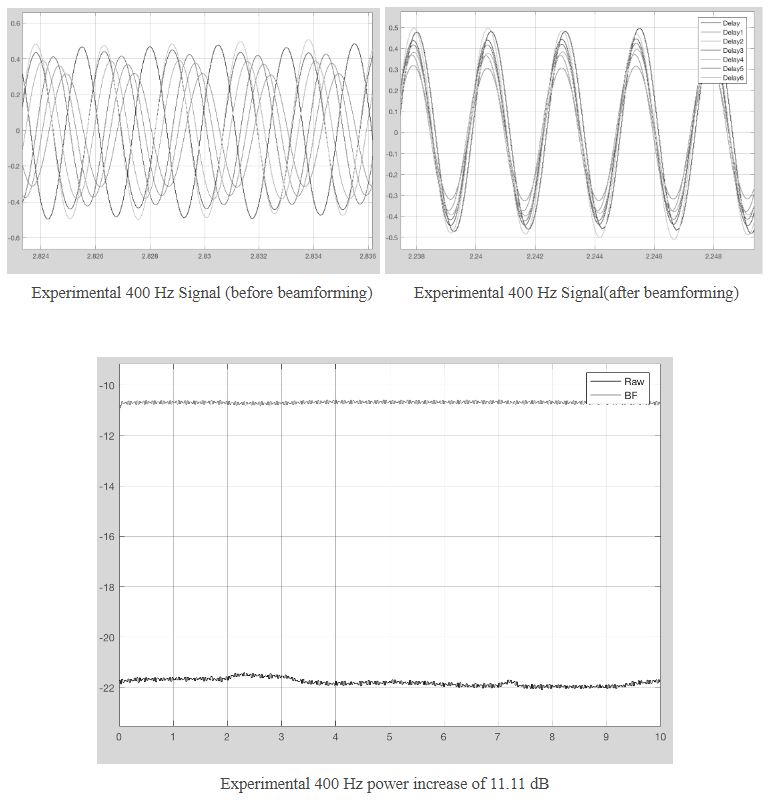
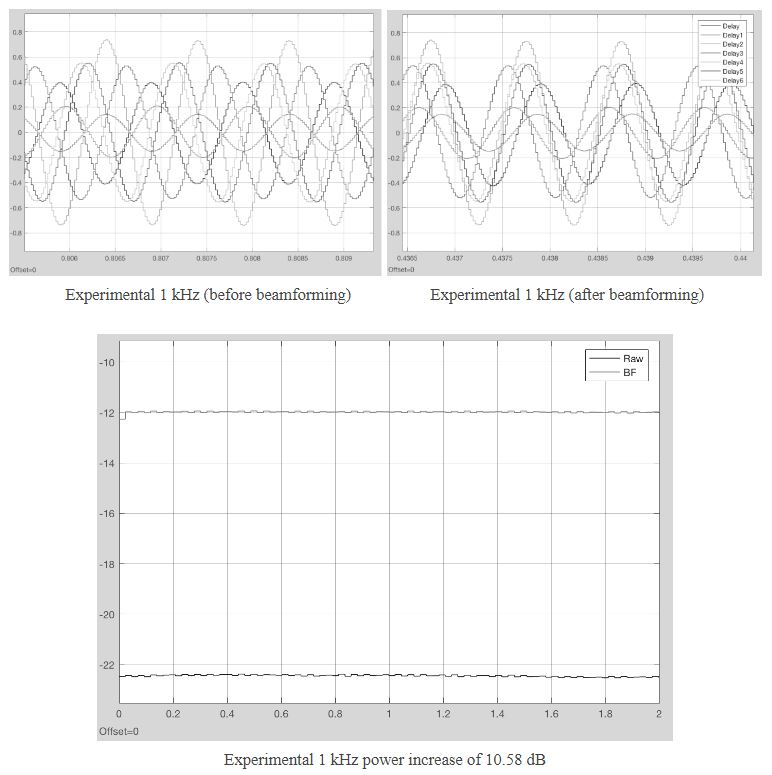
Experimental Results
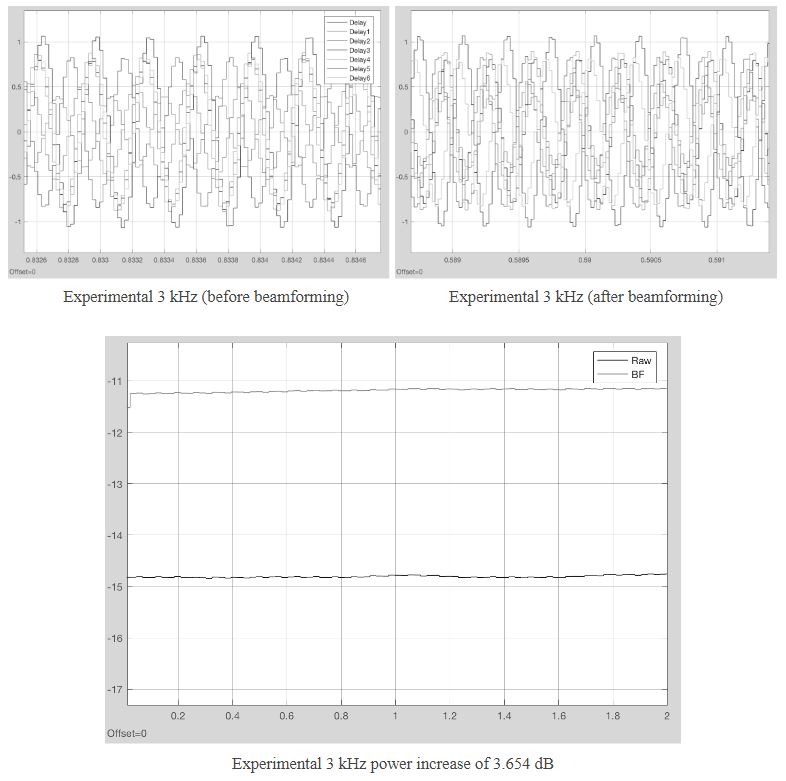
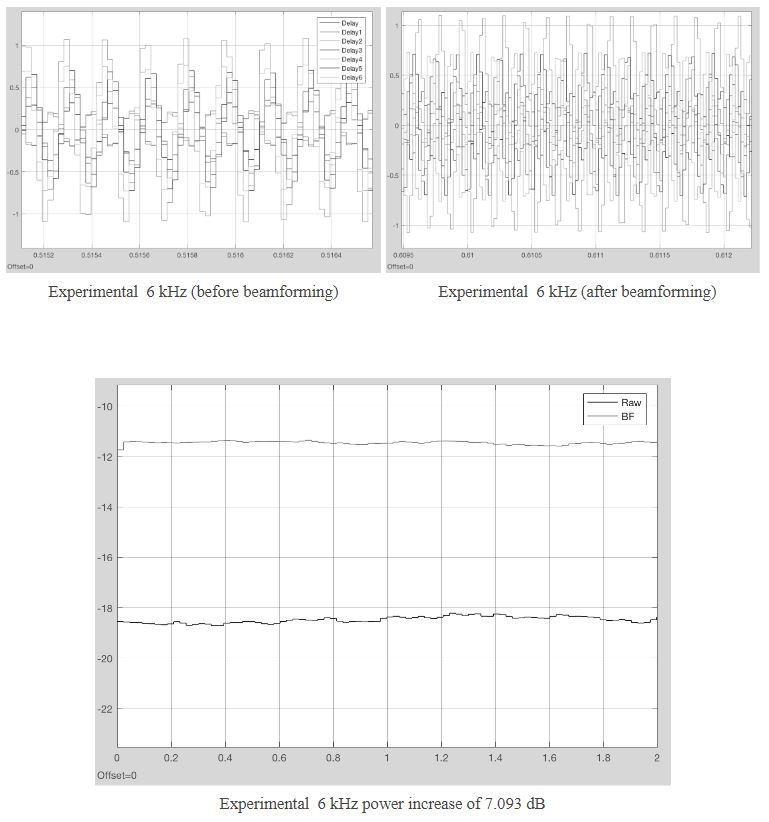
Second, the experimental results are shown. The goal of the experimental results was to see if the
system could be calibrated and could function well with real microphones. Again, the goal is to see
how much signal improvement can be obtained using real life data. The same target frequences are used
for the experimental test.
Test Setup
Experimental 400 Hz Signal
Experimental 1 kHz Signal
Experimental 3 kHz Signal
Experimental 6 kHz Signal
Theoretical vs Experimental Results