
1. Introduction
Electromyography (EMG) is a technique for monitoring electrical signals associated
with movement of muscles. EMG signals can be obtained via an intramuscular needle, or
by an electrode placed directly on the skin. Intramuscular EMG (iEMG) is more accurate
than surface EMG (sEMG) but sEMG allows electrical signals to be measured without the
need for intrusive or bulky measurement tools. Acquiring sEMG signals only requires
electrodes to be placed directly above the target muscle. When placed on the forearm,
sEMG electrodes detect muscle activity associated with the movement of a user’s hand.
Since this project is focused on the analysis of sEMG signals, when the term “EMG
signal(s)” is used throughout this report, the reader should assume these signals were
collected by using the sEMG method.
EMG signals can range from 0V to 10V, peak-to-peak. The difficult part of collecting and
analyzing the raw EMG data is the wide range of frequencies it can produce. EMG signals
can be anywhere between 10Hz to 500Hz, depending on the person and how active their
muscles are. As shown in Figure 1, even when the same person holds the same gesture
for a period of time, the amplitude and frequency of the EMG signal can still vary
quite a bit.
Figure 1: Raw EMG data (normalized) from 8 sensors on one user, making one gesture
A. EMG Applications
Medical Diagnosis and Rehabilitation
Detection of EMG signals is becoming commonplace in the biomedical field. It is being
used in medical research for diagnosis and rehabilitation [1]. In the most common case,
an EMG test can be conducted to test for a variety of muscle and nerve related conditions
and injuries [2]. Conditions that EMG testing helps diagnose include carpal tunnel syndrome,
a pinched nerve, neuropathies, muscle diseases, muscular dystrophy, and Lou Gehrig’s disease [3].
Prosthetic Control
In research, EMG signals are used to help recovering amputees control prosthetic
limbs. Even if an amputee is missing a limb, their mind can still try to move the
limb that is not there. In doing so, electrical impulses are sent to that region
of the body as if the limb was still there. For example, an individual missing
their forearm can have a prosthetic arm controlled by the EMG signals detected
in their shoulder/upper arm [4].
There are great strides being made in EMG based prosthetics. For example, researchers
at Japan’s Hokkaido University developed an EMG prosthetic hand controller that
uses real-time learning to detect up to ten forearm motions with 91.5% accuracy
[5]. Additionally, research done at Abu Dhabi University aimed to develop a
virtual reality simulation of an arm using EMG signals. They achieved an 84%
success rate in simulating the correct movements made by amputees [6]
B. Pattern Recognition Algorithms
Pattern recognition is a subset of machine learning that can be broken into
two main categories: supervised and unsupervised. In supervised learning,
the algorithm is “trained” by giving the algorithm data that is already classified.
This allows the program to have a baseline understanding of the pattern so that it
knows what to look for in the future. In unsupervised learning, the algorithm
is not given any classification information, and must draw inferences from data
on its own [7]. “The most common unsupervised learning method is cluster analysis,
which is used for exploratory data analysis to find hidden patterns or grouping in
data. The clusters are modeled using a measure of similarity which is defined upon
metrics such as Euclidean or probabilistic distance” [8].
A critical part of machine learning is an artificial neural network (ANN). ANN’s
are designed to mimic the human brain, where neurons and axons are represented
by nodes and wires. Neural networks can be designed in countless different configurations.
One form of neural network that is of interest to this project is a pattern recognition
neural network (PNN). These algorithms are used to classify input data. The network is
trained by associating training input data with known classifications. After the network
is trained, new input data is entered and the output of the neural network is a
classification for the input, based on the training stage results. The inputs for
the network play a key role in the accuracy of the network. The network will get
increasingly more accurate with more inputs, so long as there is a correlation to
the classification. Some common inputs types are raw data, filtered data, averaged
data, RMS data and other forms of data manipulation that help to relate each series
of inputs to one classification.
2. Project Goals
The current market for gesture-based control of systems rely solely on the use of cameras to detect user movements. These systems require heavy processing and restrict the user to gesture only in the field of view of the cameras. To address these issues, this project created an EMG-based controlled system with the following goals.
A. Acquire EMG data from a user
The EMG data must be collected wirelessly so as to not restrict the user. The wireless communication needs to be reliable and quick to connect. Additionally, the data must be sampled at a rate high enough for real-time operation.
B. Detect different user hand gestures in real time
This system uses three different hand gestures to control it: a fist, wave inward, and wave outward. It has only been tested on the right hand, though it should be possible to use any hand. The system needs a calibration mode to allow for anybody to use it. The calibration should be quick and allow for fast and accurate gesture recognition. Users must receive feedback about the state of the system through the console.
Implement gesture detection to control a system
The system is comprised of two cameras, each attached to its own servo motor. The hand gestures allow the user to adjust the position of the motors, as well as the camera feed that is displayed on an external monitor. The motors rotate 180°, 90° in each direction from the initial position. The cameras operate at 30 frames per second and 720p resolution.
3. System Design
In this project, gestures are captured by a Myo Gesture Control Armband made by Thalmic Labs Inc. The armband houses eight electrodes for capturing EMG signals as well as an inertial measurement unit (IMU). Since this project is focused on creating a system interface with the use of EMG signals, the IMU data is ignored while collecting data from the armband. The gestures are used to control a camera system.
A. Functions and Gestures
Table 1: Functions and their associated gestures
| Function | Gesture |
|---|---|
| Toggle armband sleep / standby | Fist |
| System Control Activate | Palm in, wave out |
| Camera Control Activate | Palm in, wave in |
| Switch to Camera 1 | Palm in, wave out |
| Switch to Camera 2 | Palm in, wave in |
| Pan Left | Palm in, wave in |
| Pan Right | 1. Start with palm facing in
2. Move wrist outward |
The full flow of logic for our system is shown below.
Figure 2: System Flowchart
B. System Diagram
Figure 3: System Diagram
There are three Raspberry Pi 3B computers used in this project, one master and two slaves. The Myo armband sends EMG data via Bluetooth to the master Raspberry Pi. The master receives, processes and then communicates desired actions to one of the two slave Pi’s. When the slave Pi gets a command, it executes a function to move the attached servo motor in a specific direction. The camera feeds stream on a webpage and, if the gesture calls for it, the master will switch the display to show the desired video stream. All master/slave communication is done on a local area network.
C. Myo Gesture Control Armband
The HMI device used for this project is an EMG armband, designed by Thalmic Labs. It is comprised of eight EMG sensors as well as a nine-axis IMU. Once connected to the armband via Bluetooth, the data is transmitted in real-time. The data is transmitted from the armband at 200 Hz and is in the form of an 8-bit unsigned integer. The raw EMG data is not the actual voltage that is sensed by the electrodes. Rather, it is a representation of muscle activation. The exact activation-to-voltage relationship is not made public by the developer of the armband.
D. Embedded System
Master
The master Pi board is the heart of the EMG Security Monitoring System. It receives the armband signal via a Bluetooth USB dongle. This signal is then processed by algorithms that identify gestures made by the user. The master Pi also sends commands to the slaves when a gesture is made to move the motors. The master is responsible for keeping track of and making adjustments to the duty cycle of the control signal sent to the motors. The master also selects one of two different camera feeds to display on an external monitor.
Slave(s)
There are two Raspberry Pi 3B computers that act as slaves to the master Pi board. Each slave is equipped with an attached camera and servo motor. They process the video signals from their respective cameras and stream the video to a webpage. The Pi cameras connect directly to the Raspberry Pi 3b and have the ability to stream live video in 1080P. These Pi boards also run the scripts (when directed by the master Pi board) to generate a change in the servo motor’s PWM duty cycle. This, in turn, controls the angle at which the camera is pointed.
E. Servo Motors
The system includes two servo motors (one per camera) that are used to pan the camera views from side to side. The motors are attached to a case which houses the Raspberry Pi and camera. The motors are powered by +5V, from the Pi GPIO pins. The Pi’s also are equipped with a GPIO pin (12) that is designed to support PWM signal outputs—this is the pin used to transmit the PWM signal to the motor in this system. The camera angles are adjusted by increasing/decreasing the respective motors PWM duty cycle. The desired adjustment (per recognized gesture) is approximately 30 degrees. The master Pi board keeps track of the duty cycle and has built-in limitations of ± 90°.
F. Monitor
The monitor setup is initialized when the system is turned on. In this system, the display switches between camera feeds based on the gestures recognized by the master Raspberry Pi board. The display is in full screen and is changed by a Python script that toggles between browser tabs that each video feed is streaming to.
G. Software
Bluetooth Communication
Because the Myo armband does not come with first-party compatibility for Linux-based operating systems, we had to seek out open source software packages. The one that we found that worked best is called PyoConnect_v2.0, developed by dzhu and Fernando Cosentino [9][10]. This software package was designed to function in Linux just like the original software functions in Windows. The only part of this code that we used was the armband communication protocol. In this package is a file called “myo_raw.py” that executes the Bluetooth communication between the USB dongle and the armband. It is this file that we edited to function as our main code for gesture detection.
Video Feed
After exploring numerous different packages for the Raspberry Pi Camera module, we
found one that perfectly aligned with our needs. Not only did it do everything we
needed, it was much easier to install and configure than anything else that we had
tried. The software is called the RPi-Cam-Web-Interface [11]. It allowed us to adjust
the picture resolution, aspect ratio, framerate, overlayed text, and countless other
items.
This software captures the video from the attached camera and streams the video feed
to the Pi’s IP address, so that the URL looks like: 169.254.13.230/html/index.php.
It works for local area networks as well as when connected to the internet. Because
it is browser based, all that was needed to switch between video feeds was to have
both open in their own tab, and to send the “ctrl+Tab” command to the Raspberry Pi.
Programming Language
The programming language for this project was essentially chosen for us. The vast
majority of documentation on programming the Raspberry Pi and the Myo Armband used
Python, so this was the natural choice for this project. For us, python was a brand
new language, with a steep learning curve. Once we got a grasp on the jargon and
syntax, it became very easy to write our own code from scratch and not have to rely
on finding reference code online.
The primary benefit of using Python (2.7.14) is that anything is possible with the
language. The drawback of this though, is that the code can be very slow to execute,
especially when combined with the slow clock speed and limited processing power of
the Raspberry Pi 3B. Nonetheless, we were able to execute our entire gesture detection
and control loop in less than five milliseconds. If the execution time got much
longer than that, we found that the Bluetooth communication would hang up and the
code would stall.
4. Technical Specifications
A. Myo Gesture Control Armband
- Physical
- Weight: 93g
- Flexibility: fits arms ranging between 7.5" and 13"
- Thickness: 0.45"
- Sensors
- 9-Axis IMU
- 3-Axis gyroscope
- 3-Axis accelerometer
- 3-Axis magnetometer
- Made of medical grade stainless steel
- Computer / Communication
- ARM Cortex M4 processor
- Wireless Bluetooth 4.0 LE communication
- Battery
- Built-in Lithium Ion Battery
- Micro USB charger
- 1 full day of usage
- EMG Data
- Sample rate: 200 Hz
- Unitless - muscle activation is represented as an 8 bit signed value
- Timestamp is in milliseconds since epoch
- Compatible Operating Systems (for the SDK)
- Windows 7, 8, and 10
- OSx 10.8 and up
- Android 4.3 and up
- Haptic feedback with short, medium, and long vibration options
B. Raspberry Pi 3B
- Processor
- Broadcom BCM2387
- 1.2 GHz Quad-Core ARM Cortex-A53
- 802.11 b/g/n Wireless LAN
- Bluetooh 4.1 (Classic and LE)
- GPU
- Dual-Core VideoCore IV Multimedia Co-Processor
- OpenVG and 1080p30 H.264 high-profile decoder
- Memory
- 1 GB LPDDR2
- Operating System
- Runs Linux OS or Windows 10 IoT
- Boots from MicroSD Card
- Dimensions
- 85 mm x 56 mm x 17 mm
- Power
- Micro USB socket 5v1, 2.5A
- Peripherals
- Ethernet
- 10/100 BaseT socket
- Video Out
- HDMI (rev 1.3 &1.4)
- Composite RCA (PAL and NTSC)
- GPIO
- 40-Pin 2.54 mm expansion header 2x20 strip
- 27-Pin GPIO
- +3.3V, +5V and GND supply lines
- Camera
- 15-pin MIPI Camera Serial Interface (CSI-2)
- Display
- Display Serial Interface 15-way flat flex cable connector with 2 data lanes and a clock lane
- Haptic feedback with short, medium, and long vibration options
C. Raspberry Pi Camera Module v2
- Camera
- Sony IMX219 8-megapixel sensor
- Video
- 1080p30
- 720p60
- VGA90
- Photo
- 8 MP
- Compatibility
- Raspberry Pi 1, 2, 3 (all models)
- Numerous open-source software libraries
5. Results
A. Raw Data and Preliminary Results
While collecting preliminary data, our goal was to test the raw armband data to verify that we can see differences in the
data when different motions are made. The armband was placed onto the thickest part of the forearm, with sensor-4 on the top
of the forearm, and sensors 1 and 8 on the bottom. Two different motions were captured: palm in, wrist action out (wave out)
and palm in, wrist action in (wave in).
The first thing we noticed, which can be seen in both Figure 2 and Figure 3, is that there is a distinct difference in the
EMG data when the arm muscles are activated. To prove this, we took samples in 10-second intervals and performed the actions
in sets of 1, 3 and 5 actions. We can clearly observe the separate actions in each data set.
The second important detail we noticed was that there is a difference between the EMG sensor data when we performed
different actions. Figure 2 shows the EMG data when the wrist is moved outward. We can see that the most muscle activation
is on sensors 3, 4, and 5. Some action is observed in 2 and 6, while a relatively low amount of action is seen in sensors 1,
7 and 8. Figure 3 shows the EMG data for when the wrist is moved inward. In this case, we see that the most activation
occurs on sensors 1, 7, and 8. There is also some activation on sensors 2, 3 and 6, while almost no activation was observed
on sensors 4 and 5.
From this point, we shifted our focus to filter and analyze the data and then implement pattern recognition algorithms.
To validate the pattern recognition algorithms, we collected and tested data from multiple users, performing multiple
actions/gestures.
Figure 4: Raw EMG Data with Palm Facing In, Wrist Action Out
Figure 5: Raw EMG Data with Palm Facing In, Wrist Action In
B. Filtering
The first stage in preprocessing the data was applying a Kaiser filter. Multiple filter options were considered and built
using MATLAB’s filter design tool. The two best filters turned out to be a 50th order Hamming filter and a 248th order
Kaiser filter, both pictured in Figure 6. After some experimenting, we decided that the Kaiser filter was our best option
and that is what we went with.
Although the filtered data was better than just the raw signal, the data still needed to be processed further to make
any sense of it. After the filter was applied, a 100-sample moving average was calculated to remove any residual noise
and smooth out the data. This gave us the ability to clearly identify when the user was gesturing and which gesture was
being performed.
Figure 6: EMG sensor data (for all 8 sensors) when passed through each filter option
As shown in Figure 7, after each stage of preprocessing the data, the distinction between which sensors are active becomes clearer.
Figure 7: Three stages of preprocessing raw EMG data, for three different gestures
C. Gesture Detection Algorithm
During the process of setting up the Raspberry Pi boards, the motors and the cameras, we developed a somewhat simplistic, yet
reliable method for gesture detection.
The first step in this process is get the averages of multiple groups of sensors. By grouping the sensors, we lower the
chances of the algorithm being affected by inaccuracies or fluctuations in just one of the sensors. The sensor groups are
shown in Table 2.
Table 2: Sensor Groupings
| Group | Sensor Combination |
|---|---|
| 1 | 1, 2, 3 |
| 2 | 2, 3, 4 |
| 3 | 3, 4, 5 |
| 4 | 4, 5, 6 |
| 5 | 5, 6, 7 |
| 6 | 6, 7, 8 |
| 7 | 7, 8, 1 |
| 8 | 8, 1, 2 |
The next step was to get some useful data from the groups. In both calibration and real-time data processing, the individual
sensor values in each group are summed and divided by 3 to get a group average. The three groups with the highest averages
are then selected to represent a gesture.
Calibration data is collected and the three highest group averages, for each gesture, are stored as a variable. When a
user gestures with their arm, the confidence algorithm (described below) compares the groups of the real-time data to the
groups of each calibrated gesture. Then, based on the relationship of matching groups, each calibrated gesture is assigned
a confidence level. A threshold was implemented for the highest confidence level, which needed to be met to confirm that a
perceived gesture was intentionally performed by the user. If the minimum threshold (10) is satisfied by at least one of
the gesture comparisons, the algorithm has confirmation that the gesture with the highest confidence value is indeed the
gesture that was made by the user.
To compare the real-time gesture data to the calibration data, each “match” of the top three groups are assigned a weight.
For example, if the highest group average in one of the gestures calibration data matches the highest group of the real-time
data, then the confidence in that action rises by 10. Then, if the second highest groups match, the confidence level for
that action is increased, again, by 6. Finally, if the third groups also match, an additional 4 points are added to that
gesture’s total. In this case, the total points for that gesture would be 20 (10 + 6 + 4), which is the highest level of
confidence possible. Lower confidence points are awarded for partial matches, which would be when the groups match but in
a different order. See Table 3 for the confidence points assignments. See Table 4 for an example of how the totaling of
points works.
Table 3: Confidence values given for different pairings of top sensor groupings
Table 4: Example of confidence points awarded
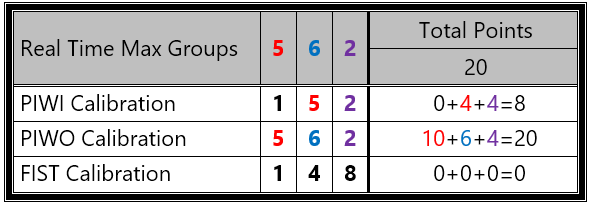
In the example shown in Table 4, the confidence algorithm would have returned PIWO as the gesture
detected because it had the highest confidence level (20), and the confidence level exceeded the
threshold for gesture confirmation (9). The first, second and third highest values all matched,
in the correct order, to the PIWO calibration data.
The values assigned for the confidence points were obtained experimentally through trial and error.
We started out by using a plot (see Figure 8) to make a visual comparison between the highest group
averages. As you can see, we started with the data on the plot but that format made it difficult to
recognize patterns in the data. We then decided to remove the data and only keep the group average
lines (see Figure 9), which significantly helped in identifying patterns in the top three group
averages.
We then started to assign values by simply using values of one, two and three but quickly realized
that was not going to work. We then realized that the correct order of the max averaged groups
should increase the confidence, since it is another quality of the relationship between the
real-time and calibrated data. We also lowered the point awarded for the matches that were out
of order but did not want to completely disregard this relationship because the max group order
does vary from time to time. We set it up so that if the max sensor groups matched, it was enough
points to confirm a gesture. If not, then if the second and third highest matched, that would
also tally enough confidence points that the gesture would also be confirmed. The final points
we settled on were shown in Table 4.
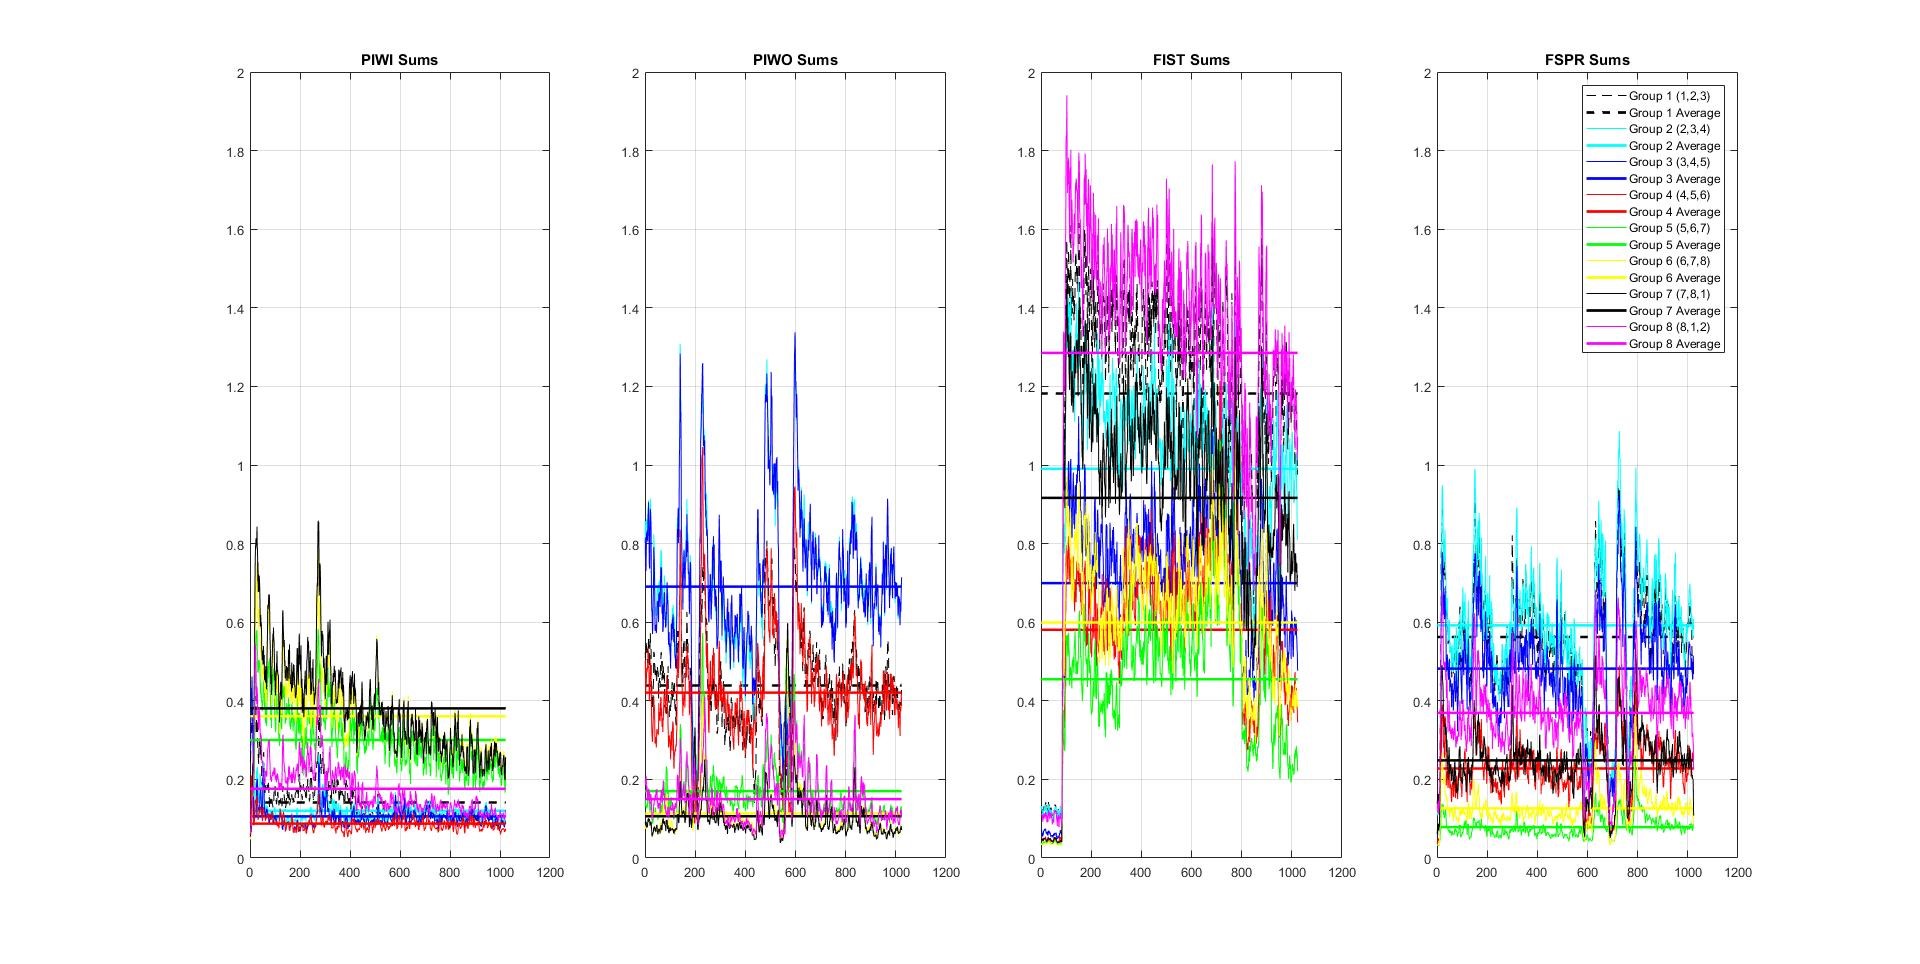
Figure 8: Sensor group sum data with the group average lines
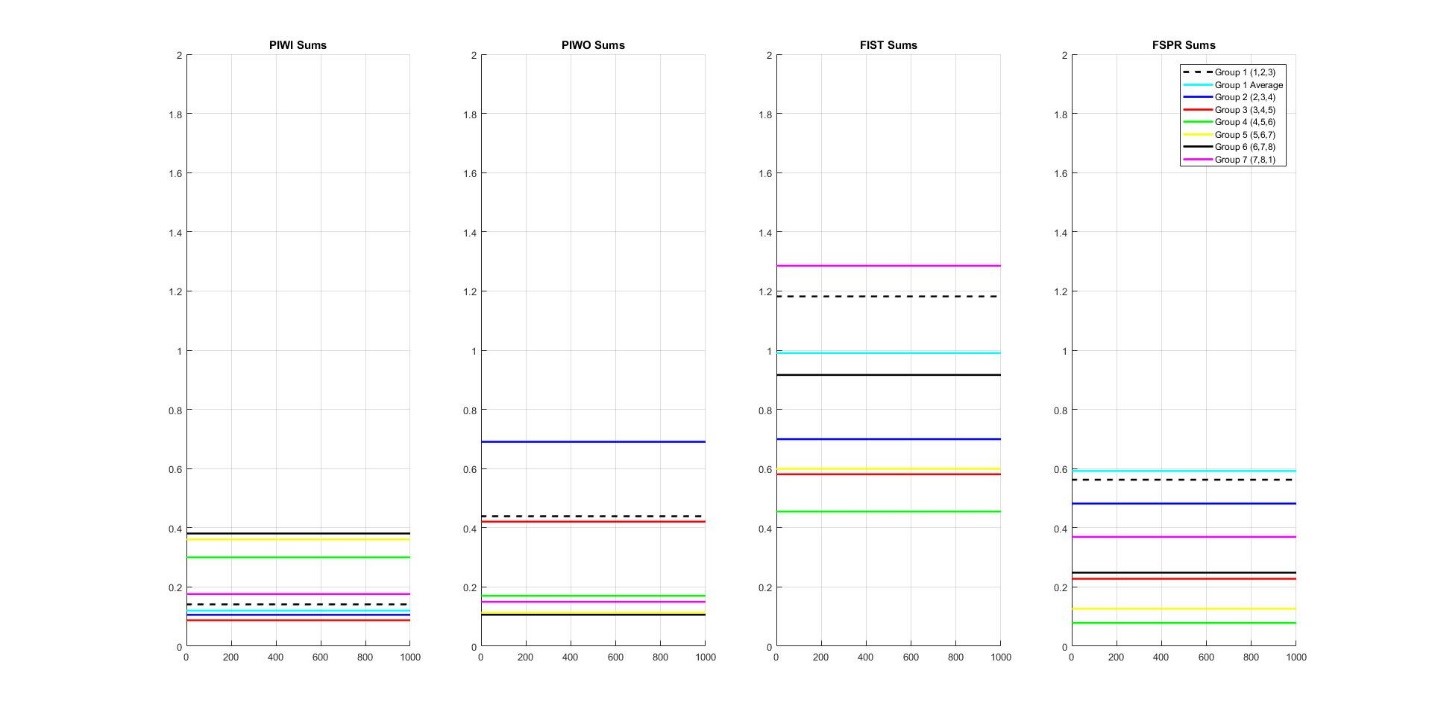
Figure 9: Line plots representing the group averages of different motions
6. Future Work
We highly suggest that research into using EMG data from the Myo armband be continued. For future
projects, if our pattern recognition algorithms are not suitable, we would suggest implementing
a neural network for gesture detection.
In this project, our efforts were not concentrated on implementing a neural network. We did, however, begin a small
amount of research into the using a neural network. MATLAB has a built in neural network toolbox that we utilized.
According to the MATLAB documentation on the newpnn function, a probabilistic neural network (PNN) is “a kind of
radial basis network suitable for classification problems [12].”
To start out with, we used raw data and used the sensor values and their sum (for each sample) as the training input
and used a numerical representation of the gesture (1 through 5) for the target vector. We trained the neural network
with one set of data and used data from a second person to validate the accuracy.
Using just the nine original inputs (eight raw sensor values and their sum) the PNN could only achieve an accuracy
of 77.8%, which is shown in Figure 10. Since this accuracy would not be sufficient for use, we then used the
preprocessed data (filtered and with the moving average), the average of the eight samples and their sum as the
inputs. With more inputs to the training network, we were able to get a much higher accuracy of 86.0%. The
confusion chart shown in Figure 11 represents the accuracy using these inputs.
It became clear that with more inputs, or at least more meaningful inputs, to the PNN, the accuracy would continue
to increase. We did not, however, intend on the use of the PNN for this project due to the limitations of our
system. Our research into the PNN was meant as a starting point, should this project be continued in the future.
If a neural network is considered for a future project, more powerful microprocessors or digital signal
processors (DSP) would be needed to replace the Raspberry Pi computers we used to process the data.
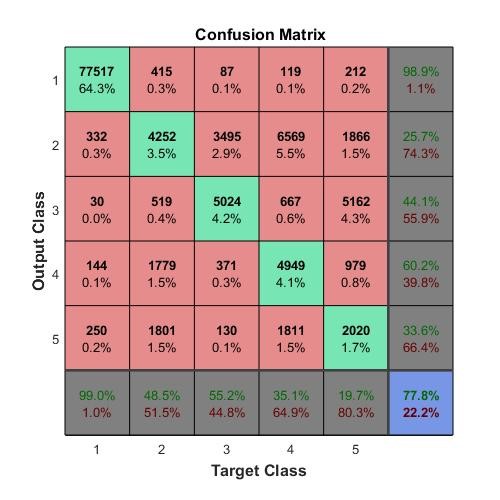
Figure 10: Confusion matrix using the raw EMG data as the PNN inputs
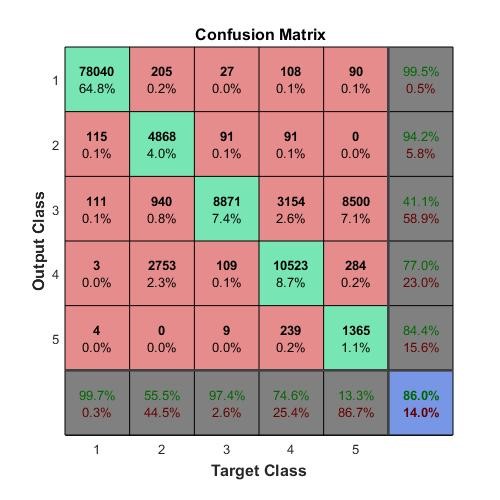
Figure 11: Confusion matrix using the preprocessed EMG data as the PNN inputs
Summary
Historically, the ability to control a system with hand gestures has been limited. Gesture control often required bulky equipment
or relied on image processing to track user motion within the viewing range of a camera. This project addressed this limitation by
developing a lightweight system that is controlled only by hand gestures detected via electromyography. Hand gestures are detected by
analyzing the EMG signals produced by muscle activity in a user’s arm. The EMG signals from the arm are captured by the Myo Gesture
Control Armband. We developed an algorithm to process the EMG data to quickly and accurately recognize three unique hand gestures.
It is these hand gestures that are used to control the camera system.
In addition to getting this system running, we explored advanced methods of pattern recognition, including neural networks and
support vector machines. We achieved fairly high accuracy using a pattern recognition neural network, and are confident that given more
time and effort, this method can be a viable form of gesture detection.
From the start of this project, our goal was to collect and analyze raw EMG data with the intention of putting it to use in a control
system. Our goal has been accomplished by implementing an algorithm to detect gestures and control a camera system. Additionally, we have
laid the groundwork for future projects in the EMG based HMI field by starting the research into more accurate methods of gesture detection.
References
- M. B. I. Reaz, M. S. Hussain, and F. Mohd-Yasin, “Techniques of EMG signal analysis: detection, processing, classification and applications,” Biological Procedures Online, vol. 8, no. 1, pp. 163–163, Oct. 2006.
- “Electromyography,” Medline Plus, 06-Nov-2017. [Online]. Available: https://medlineplus.gov/ency/article/003929.htm. [Accessed: 10-Nov-2017].
- J. H. Feinberg, “EMG Testing: A Patients Guide,” Hospital for Special Surgery, 21-Oct-2009. [Online]. Available: https://www.hss.edu/conditions_emg-testing-a-patient-guide.asp. [Accessed: 05-Nov-2017].
- S. Sudarsan and E. C. Sekaran, “Design and Development of EMG Controlled Prosthetics Limb,” Procedia Engineering, vol. 38, pp. 3547–3551, Sep. 2012.
- L. Fraiwan, M. Awwad, M. Mahdawi, and S. Jamous, “Real time virtual prosthetic hand controlled using EMG signals,” in Biomedical Engineering (MECBME), 2011 1st Middle East Conference on, 2011, pp. 225-227.
- C. Donalek, “Supervised and Unsupervised Learning,” Caltech Astronomy, Apr-2011. [Online]. Available: http://www.astro.caltech.edu/~george/aybi199/Donalek_Classif.pdf . [Accessed: 01-Nov-2017].
- “Unsupervised Learning,” MATLAB & Simulink. [Online]. Available: https://www.mathworks.com/discovery/unsupervised-learning.html. [Accessed: 14-Nov-2017].
- D. Zhu, “myo-raw,” Dec-2014. [Online]. Available: https://github.com/dzhu/myo-raw. [Accessed: May-2018].
- F. Cosentino, "PyoConnect_v2.0," [Online] Available: http://www.fernandocosentino.net/pyoconnect/.
- “RPi-Cam-Web-Interface,” elinux.org. March 18, 2018. [Online]. Available: https://elinux.org/RPi-Cam-Web-Interface. [Accessed: May-2018].
- Mathworks. (2017). Neural Network Toolbox: User's Guide (r2017a). [Online]. Available: https://www.mathworks.com/help/nnet/ref/newpnn.html?searchHighlight=newpnn&s_tid=doc_srchtitle