 |
| Progress Prior to December The device is currently in the data collection phase. Several algorithms have been prepared, so that the device may be optimized as soon as the data is ready. The algorithms that are being used are designed by Sean to calculate the minimum needed sampling frequency, minimize the number of false positives from high acceleration activites, and minimize the number of overall false postives. These algorithms are going to be used to minimize the current project that has already been created. |
False Postives Due to Fast Movement Currently the device operates by checking the acceleration of the user against a threshold based on the acceleration due to gravity. This may be set off by any sudden acceleration. We intend to offset this problem by also looking for a sudden decrease in the acceleration. This would be consistent with someone hitting the ground after falling, and would serve to make the criteria stricter. |
Overall Error Reduction We intend to reduce the overall error by using a gradient descent method. This gradient ascent method will use the mean square error as the function call, and will examine our statistical thresholds. Optimizing our statistical thresholds should give us the lowest possible error with our current algorithm. |
| Final Results For data collection, the test cases that were determined to be useful included walking, running, sitting down, lying down, standing, standing up and falling for all appropriate cases. The test cases were plotted using MATLAB. The X-axis of each of the plots are Time. The Y-axis is dependent on what plot, so it is either the raw data of the sensor, magnitude of the sensor data, and normalized data for each sensor. The plots were then analyzed based on the ‘peak acceleration’ to distinguish the type of motion that the user has performed. Based on the peak values it can be determined whether there was a fall or not. 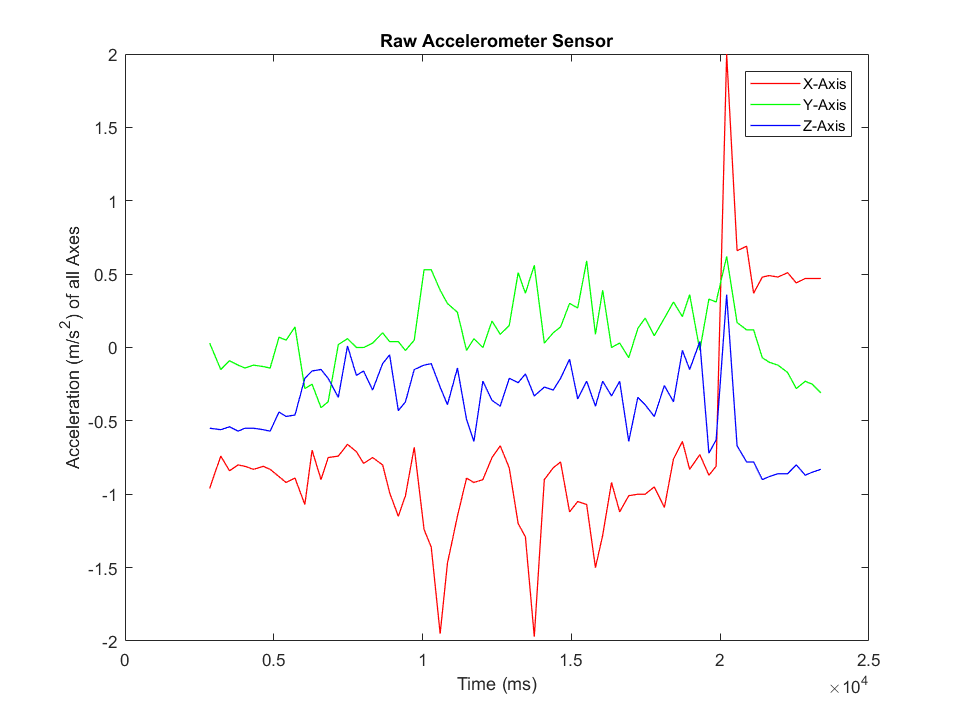 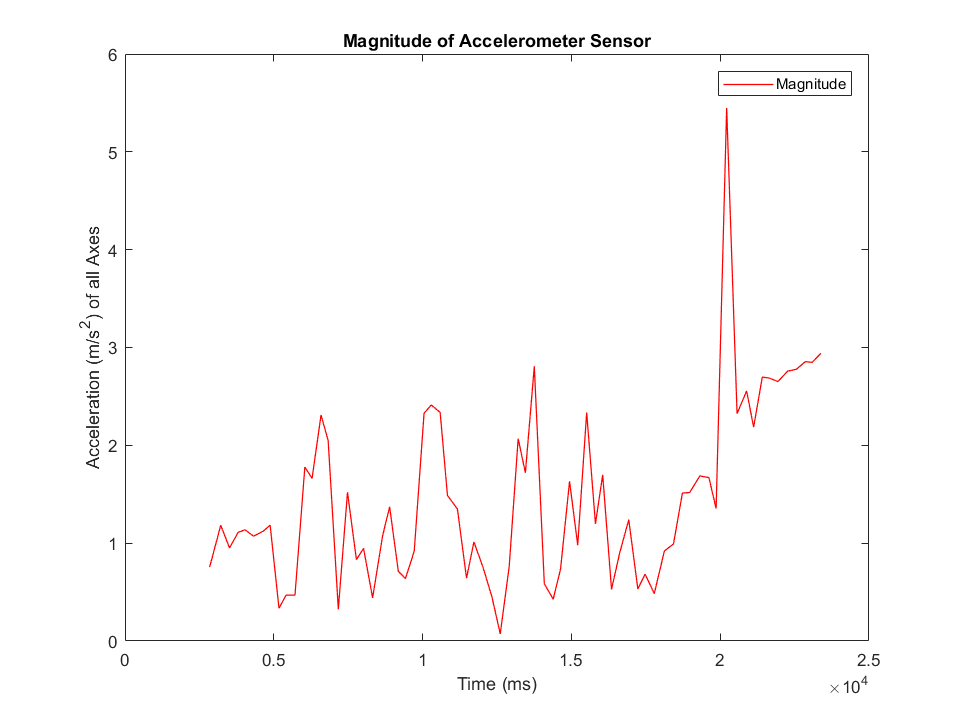 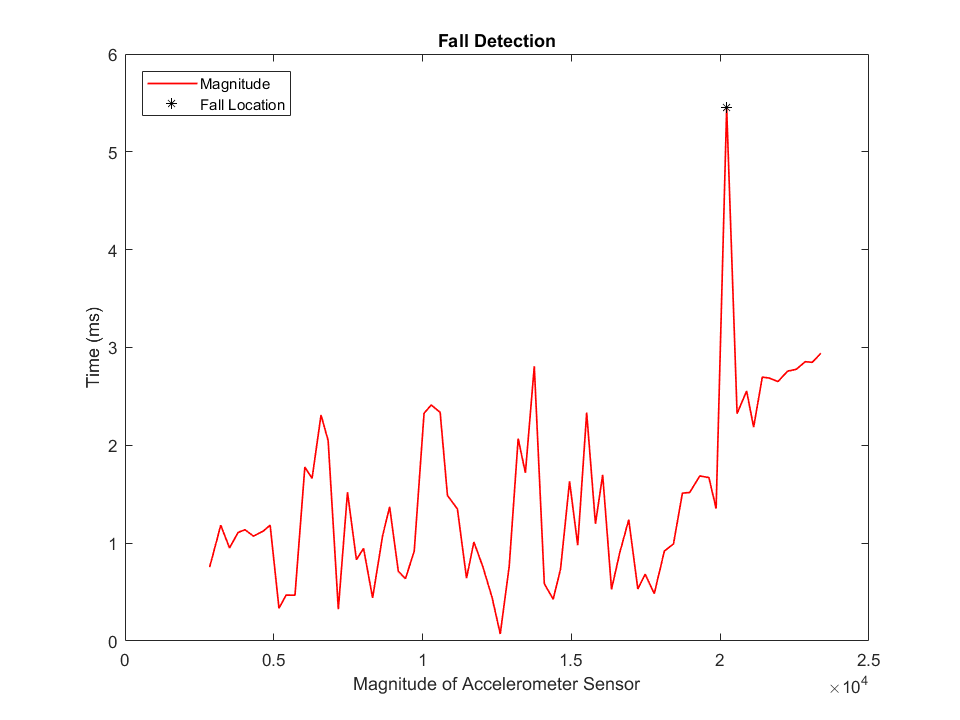 During the data collection process, the device system was contained in an attachable 3D printed box. The box has the measurements of 3.5” x 2.5” x 3”. The reason for the box to be 3D printed is to help minimize the Bluetooth interference that was inexperienced with the old metal box. It is also able to be attached with a belt for the wearer of the device. Since it was attachable to the waist, the data was able to be consistently measured at the same position. |
Bluetooth Device Streaming The Bluetooth data streaming was a large challenge to overcome. It was not fully overcome by the end of the semester. When initially trying to get the device to connect via Bluetooth to a laptop, it wasn’t wanting to stay connected. To fix this issue, that was reoccurring, it required less intermittent connections from the IMU to the Bluetooth module. The next step was to get the transmitted data to display on the output serial monitor. For this to happen, the baud rate needed to be set to the default value of 115200 bits per second instead of the 9600 bits per second. |
Real-Time Fall Detection The real-time fall detection is more of a post analysis fall detection algorithm, at this time. It is still based on the same concept of threshold and comparison of magnitudes. It takes the streaming data and compares to the threshold continuously. The Real-Time Fall Detection is still currently in testing and optimization phases. |
Fall Alert Messages The fall alert messages are SMS based messages that get sent from a SMTP server using an email and the recipient's phone carrier. For this portion of the code to work the flag a fall detection must be set high. Once the flag is set high, the code runs through a for loop of contacts, verifying the length of the number is valid. Once this is true, a message gets sent to the server and then the server will convert it from an email format to an SMS format and send that message to the recipient. With having a for loop that runs through any number of contacts, the system can contact as many emergency contacts that are programmed. |
Data Logging - Circular Buffer For data logging, all the data gets saved to the microSD card that is inserted into the IMU. The microSD card size can be of any size, during this project a 32 gigabyte was used. However, once that space is filled, it can cause a lot of problems, especially if a fall were to happen after the microSD card was filled. To handle this issue a circular buffer was designed to delete the first log that does not have a fall. |
Power Management Power management was a great accomplishment that was needed to be completed. For the first step of this process we needed to find what was causing the drainage of the battery. While doing this it was also found that the gyroscope was not needed. So, the ability of not collecting data using the gyroscope gave some needed time. Another way to help gain more time is to use a less power dependent form of data transmission. There was an improvement from 6 hours to 17 hours worth of battery life, just from optimization of the code and no longer needing to read and transmit from the gyroscope. |
Neural Network To solve the problem of false positives for fall detection, it was determined that an artificial neural network would be an effective solution and classifier for the falls. Since fall detection is a time-based problem a recurrent neural network would be the best option. Another portion of the neural network solution was to have a deep neural network. The training for the neural network was performed by classifying every sample point within a dataset. If any of the samples contained a fall, then the dataset would be identified as a fall dataset. This identification would then be cross referenced with other datasets that contained falls, this allows for the error to be calculated. Using the Scientific Python function, backpropagation was used to minimize and potentially reduce the error. The following figure shows a general three hidden layout, which is how the neural network was designed.  |
Discussion of Results Through the observation of the testing results, it can be concluded that a fall will generate an acceleration value between 4 m/s^2 and 6 m/s^2. These values are greater than the 1.5 m/s^2 acceleration that was observed for normal motions, such as walking, sitting, and running. A normal acceleration for the common motions of movement were from 1.5 m/s^2 to 3 m/s^2. This allowed for the peak threshold to be 4 m/s^2. This threshold was chosen to eliminate false positives. It was discovered through the testing process that the magnetometer readings were useful for finding where a fall has occurred. Once this was discovered the fall detection algorithm was updated to use these values. In the future, a better fall detection algorithm will include a threshold for both the accelerometer and magnetometer data. Another observation that was found was that the placement of the device on the user could give skewed results depending on how the user falls. So, if the user were to fall on the same side as the device then the data would have a higher magnitude because there was not a dampening factor of a human body. A better way to handle this situation would to have the device at the center of mass of the user. The issue with this is that depending on different movements the center of mass is in a different location on a human body. That is why for testing purposes we determined the waistline to be the best fit at this time. |
Conclusion Over the past two semesters of working on this project, the objectives and goals were successfully accomplished. The objectives of this project were to minimize the size of the device system, maximize the battery life, eliminate false positives of the fall detection algorithm, and provide data for future corrective measures. There were also a few additions that were made that were not originally in the plan of action. These additions consisted of an attachable case, microSD card data logging, and circular buffer system for data saving. To minimize the device, we ended up using a single board system, where the battery could directly plug into the device instead of needing a second board to regulate the battery voltage and charge the battery. The new IMU board was also smaller in size. As discussed previously the battery life was maximized from 6 hours to 17 hours of constant usage. The increase came from not having to power two boards and not having to collect data for more than the necessary sensors. The elimination of false positives came from the redoing of the previous fall detection algorithm and using the magnetometer and accelerometer data outputs. To accomplish the last objective was rather easy, since it was just collecting a bunch of data that can be used in the future. In the future of this project, it would be recommended that a different less power intensive data transmission board be used, another form of data transmission, such as WI-FI, the addition of a central data storage station, the ability to manually use the device, and detection of the device being dropped. With the change of data transmission applications, the battery can potentially last longer, the data could be more accurate, and there would be less data loss during the transmission. If there was a dedicated data storage station, anyone would be able to see the data and it would be easier for data collection. The ability to have a manual option would help for the occasions of when a fall has happened, but the user does not need any help or if the user needs help from a fall that does not get correctly detected. It would also be useful to be able to tell the difference between a fall or the user fumbling with the device and potentially dropping it. This is significant so that the emergency contacts are not contacted for a non-fall. |