Active Noise Cancellation System
Senior Project Website
Photo Gallery
Active Noise Cancellation with an LMS Adaptive Filter for the XtremeDSP Board
Figure 1.1 containes an input signal, output signal, reference signal, error signal, and adaptive filter to behave as an active noise cancellation system. The interference and reference signals are ultrasound data that has been evaluated in MATLAB and input into the system by using two ROM block. Ultrasound data was chosen to test the hardware design by comparing MATLAB simulations results to the output of the design in Figure 1.1.
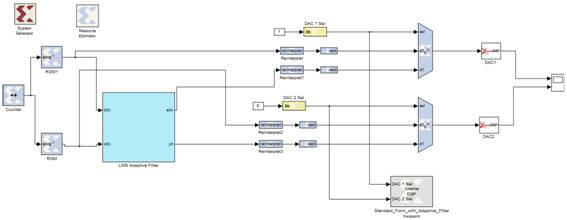
Figure 1.1 Active Noise Cancellation System with an LMS Adaptive Filter for the XtremeDSP Board
LMS Adaptve Filter for the XtremeDSP Board
The adaptive filter, Figure 1.2, was designed to separate the adaptive coefficients and FIR filter so it would be easier to change between the different structures of FIR.
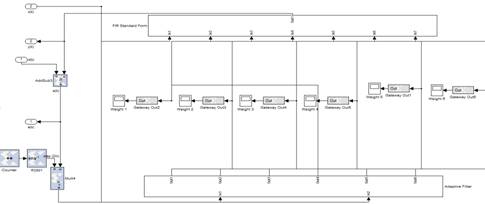
Figure 1.2 LMS Adaptive Filter for the XtremeDSP Board
Adaptive Coefficients for the XtremeDSP Board
The design to calculate the adaptive coefficients for XtremeDSP board is shown in Figure 1.3. It uses the standard LMS algorithm to update the coefficients with the error signal and the filter input signal.
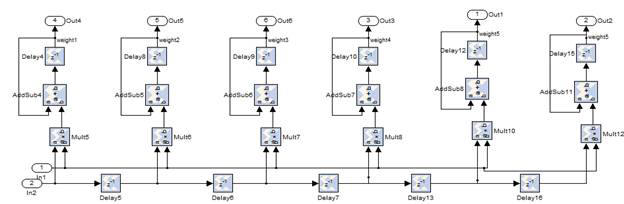
Figure 1.3 Adaptive Coefficients for the XtremeDSP Board
FIR Filter for the XtremeDSP Board
The design in figure 1.4 is a standard form FIR filter.
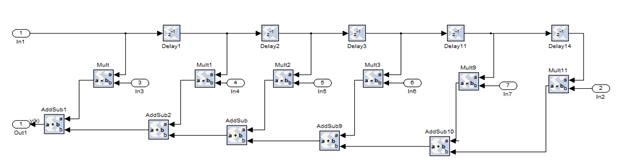
Figure 1.4 FIR Filter for the XtremeDSP Board
Result of the Active Noise Cancellation System Design for the XtremeDSP Board
Figure 1.5 displays the reference signal (orange) and the output signal (blue), which were captured from the oscilloscope. The signal was then transfered to MATLAB to verify the results. Figure 1.6, the bottom graph, Simulation Output Signal (y), is the output of the hardware design for the active noise cancellation system design. The signal was compared to the top graph, Hardware Output Signal (y), to ensure that the design was working.
Figure 1.5 Oscilloscope Results
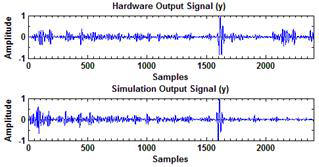
Figure 1.6 Comparison of the Output Signal plots