Active Noise Cancellation System
Senior Project Website
Photo Gallery
Active Noise Cancellation Design with an LMS Adaptive Filter for the SignalWave Board
The design in Figure 2.1 contains an input signal, output signal, reference signal, error signal, and adaptive filter to behave as an adaptive noise cancellation system. For the input and reference signals, a microphone was used to record the two audio data used previously: a woman saying “give me a pen” and a car motor. These two audio samples were then mixed to simulate the target signal being corrupted by background noise. A simple moving average process was used to corrupt the target audio signal. It was chosen to simulate the noise echoing and being recorded several times at different intensities. The original noise file was then used as the filter input signal. These signals were then output through the audio jack on a PC into the SignalWave Board. The signal wave board then used the real-time active noise cancellation to recover the target audio signal and output it to a speaker
Figure 2.1 Active Noise Cancellation System with an LMS Adaptive Filter for the Signal Wave Board
LMS Adaptive Filter Design for the SignalWave Board
The adaptive filter, Figure 2.2 resembled the adaptive filter design used in the FPGA board, Figure 1.2, contains the adaptive coefficient design and FIR standard form design.
Figure 2.2 LMS Adaptive Filter for the Signal Wave Board
Adaptive Coefficients Design for the SignalWave Board
The model in figure 2.3 was designed similarly to figure 1.3.(In the section for ultrasound data) The main difference is the number of taps is increased to 10. This is done because the data used is audio instead of ultrasound.
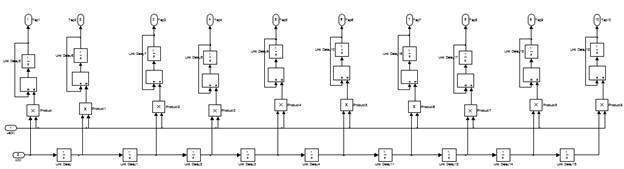
Figure 2.3 Adaptive Coefficients for the Signal Wave Board
The design in figure 2.4 is a standard form FIR filter.
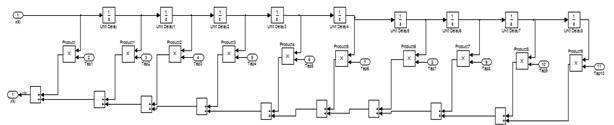
Figure 2.4 FIR Filter for the Signal Wave Board
The results obtained for the hardware implementation, figure 2.5 and 2.6, show slightly more engine noise remaining in the recovered signal. The engine noise is still significantly reduced. The audio signal can be clearly heard, but only a 14.6 dB reduction in noise was obtained
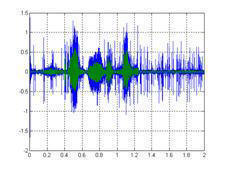
Figure 2.5 LMS Desired and Recovered Signals
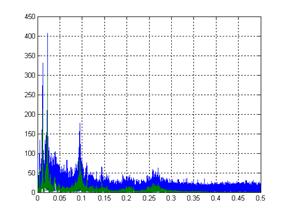
Figure 2.6 Ouput Comparison