Banner

April 2006
SMTWTFS
      1
2345678
9101112131415
16171819202122
23242526272829
30      


USB Logic Analyzer


The goal of this project is to continue design for a USB logic analyzer to be used in the junior labartory. The design uses an Opal Kelly XEM3001 FPGA board which communicates over USB 2.0 to a GUI written in C#.  more...

shom on 10.04.05 @ 03:50 PM CST [permalink]


Wednesday, April 26th

Project Completion and Final Presentation


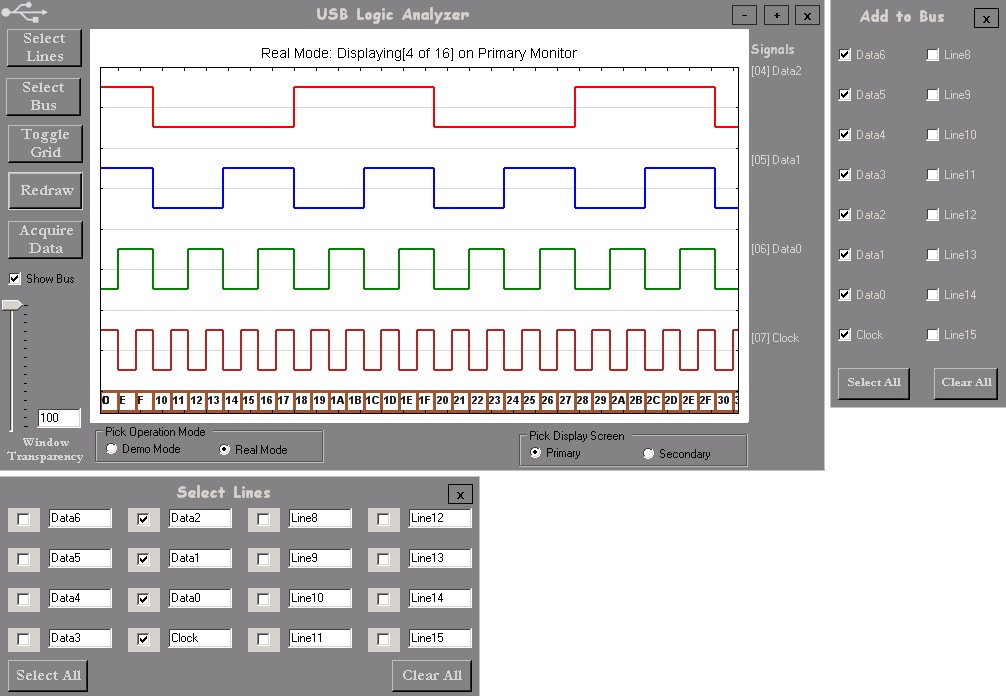
The USB Logic Analyzer is a fully functional standalone software application now. It is interfaced with the XEM3001 FPGA board and it reads simulated data (8-bit binary counter) from the FPGA over USB correctly. I was able to figure out how to communicate with the FPGA board and read the buffer and then use part of Jason's C++ program from last year to parse the data correctly. Since there is no external PC board (hardware part of the project was terminated when Jeff left the project) to sample signals the FPGA puts an 8-bit binary count value in the buffer, which is a great way to demonstrate functionality.

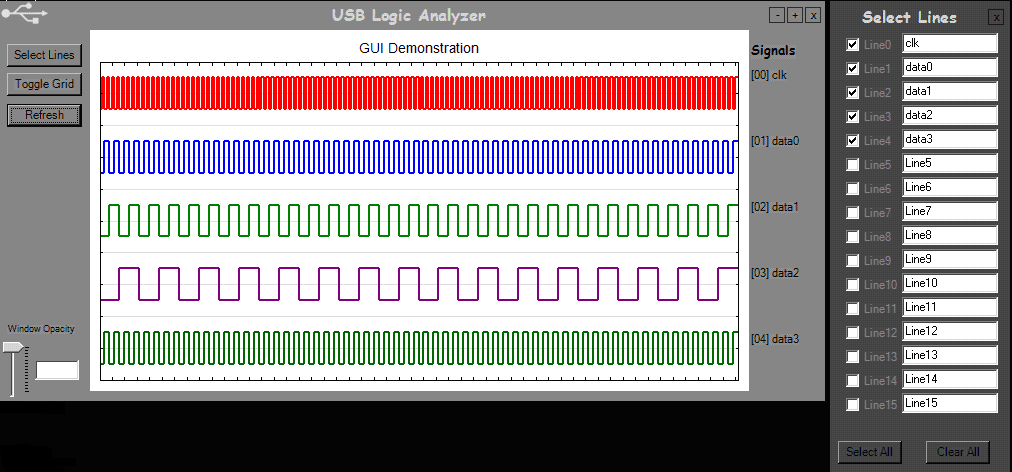
On the software side there have been tons of additions. I added in a data bus, I was able to read the logic lines and combine them into a hex value that is displayed on the plot surface. The user has the ability to select the lines added to the bus independent of the lines being plotted. The user can also save the plot in image format (png, jpeg, bmp, and gif) or in numeric format (csv). The saved CSV data file can be loaded back into the application in the future and all the software features can be used for analysis. The screen shot of the application visually explains a lot of these features.

FinalGUI (32k image)

The project will be presented to faculty and students at the Senior Capstone Presentations on April 27th (tomorrow) at 8:30am. The presentation will be made available as part of the deliverables at later date. The final demonstration of the project will take place in Senior Lab on Friday, April 28th between 12 and 1 pm.

The final post to this website will be made once the final report has been approved for submission, at which point the project will be completed and all deliverables will be available here.

shom on 04.26.06 @ 01:52 PM CST [permalink]


Thursday, April 13th

Live Demo @ the Bradley Student Expo


The project works!

The Opal Kelly XEM3001 sends an eight bit data stream over USB to the C# core program via some C++ executables (soon to converted to pure C#). The C# GUI plots the acquired data and still allows for all the functionality mentioned in previous entries!

Expo visitors will be able to play with the product using a 17" touch screen monitor (the GUI was modified for easier touch navigation).

The project is successful!

shom on 04.13.06 @ 03:56 AM CST [permalink] Kudos: -7 (+/-)


Thursday, March 30th

Gooeyer GUI


I have been adding a lot of GUI features. I modified the LineSelect form to include text boxes for all the lines so that an user can specify custom names. I added all the labels using the form designer and then manipulated their text, and position using code to reflect:
*what lines were selected
*what names they were given
*what line plot corresponds to that signal
Positioning was a difficult task especially with keeping resizing in mind.

I also improved error handling, especially focusing on application crashing when no lines were selected to be plotted. I found that this scenario was problematic for everything... plotting, resizing, refreshing, any form movement at all. Currently the GUI is fairly stable and mostly idiot proof.

My next challenge is to add the bus and use the mouse cursor to read the bus value and display it.

Here's a snapshot of the current GUI:
gui5 (30k image)

Again, if anyone is interested in helping me test the application, you can download and run the compiled binary (for Windows XP) and provide me with any feedback via e-mail.

shom on 03.30.06 @ 07:28 PM CST [permalink] Kudos: 4 (+/-)


Sunday, March 26th

Gooey GUI


I have mostly been working on and testing the GUI. Although, there is a separate time alloted for testing, the nature of GUI development leads to on spot testing. I will say that about 50% of the time I spend on the project is for development and the other 50% is testing. I have also changed how the data is stored internally form a double format to an integer format, this means less memory usage and faster processing. The logic level representation also had to be changed from the double representation:
'0.00' - Low
'0.50' - Indeterminate
'1.00' - High

to the integer representation:
'-1' - Low
'0' - Indeterminate
'1' - High

I have made a lot of progress on the GUI. The user now can:
*Select and plot only specific lines
*Lines can be selected in arbitary order
*Closing the main application closes all related windows
*Super impose a vertical grid, corresponding to the rising edge of the fastest signal
*Toggle the grid on and off
*Change the opacity of the application window
*Maximize/Minimize window
*Identify application by custom icon (in Windows ALT+TAB window)

Here's a snapshot of the current GUI.
GUI3 (51k image)

I am working on adding more features to the GUI and representing buses. If anyone is interested in helping me test the application, you can download and run the compiled binary (for Windows XP) and provide me with any feedback via e-mail.

shom on 03.26.06 @ 07:04 PM CST [permalink] Kudos: 6 (+/-)


Thursday, February 23rd

Gra Graph Graphics


The focus of the project has changed slightly due to the fact that Jeff Earlson is no longer working on the hardware. There is a possibility that there will be no board to test the USB data acquisition with. In light of these events I have decided to focus more detailed attention on to the graphics. The NPlot graphing library is very complicated because of its robustness, so adding a bus class has been a difficult task.  more...

shom on 02.23.06 @ 04:58 PM CST [permalink] Kudos: 18 (+/-)


For more development reports read the Archived Entries