
Non-Suppressed Carrier Amplitude Modulation
Fig 1 System Level Block diagram of Non-Suppressed Carrier AM

Fig 2 Simulink Non-Suppressed Carrier AM Block Diagram
Generated Sine wave = .5Sin(1500*2*pi*t) This is the Carrier Frequency.
x(t) = 1Sin(500*2*pi*t) This is the signal entered into the system.
Scope Plots
Fig 3 Experimental Plot of AM, Time domain
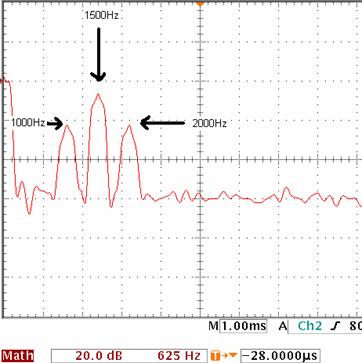
Fig 4 Experimental FFT of Fig 3
Note the Carrier frequency at 1500Hz is considerably stronger than x(t) at 500Hz
In both the experimental and the MATLAB (below) simulations, note that the 500Hz
signal is shown by the Sum and differences
around the 1500Hz signal, at 1000Hz and 2000Hz
MATLAB Simulation

Fig 5 FFT of AM in MATLAB
Demodulation
To retrieve the original 500Hz signal, a demodulation
system must be designed. The absolute value will be taken of the signal,
and a low pass filter will be used to obtain the signal.